20 Sep 2026
Uncovering Patterns in Athletic Event Outcomes Through Historical Data Analysis
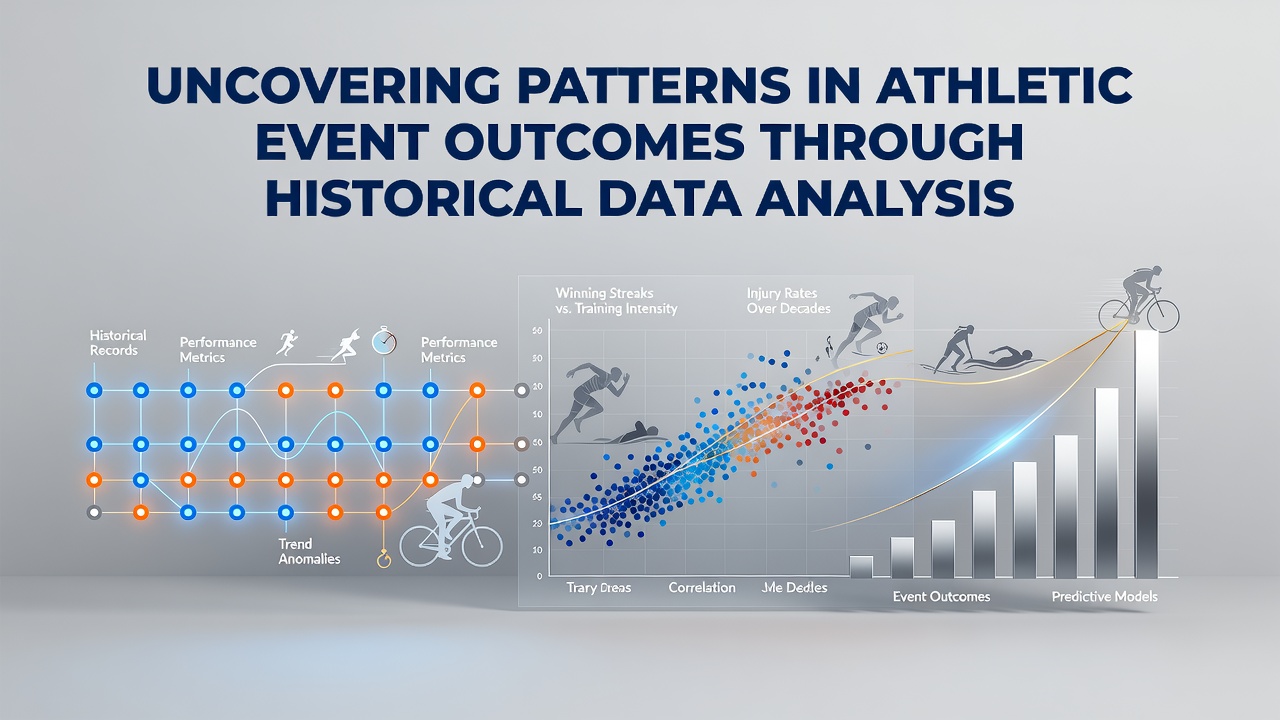
Analysts have long examined large datasets from professional and amateur leagues to identify recurring sequences in game results, player statistics, and team dynamics. Historical records from baseball, soccer, basketball, and other sports provide the raw material for these examinations, and organizations maintain extensive archives that stretch back decades. Researchers apply statistical models to these collections, and patterns emerge around home-field advantages, seasonal fatigue effects, and matchup-specific tendencies that repeat across multiple years.
Data Collection Foundations
Leagues and governing bodies compile play-by-play logs, box scores, and biometric readings that form the backbone of any pattern study. In the United States, the National Collegiate Athletic Association maintains detailed performance repositories that cover thousands of contests annually, while similar efforts in Australia through the Australian Institute of Sport aggregate training and competition metrics from national programs. These datasets include variables such as scoring margins, possession time, injury occurrences, and weather conditions at the time of each event. Analysts cross-reference these elements with external factors like travel distance and schedule density to isolate variables that consistently influence final scores.
Analytical Techniques in Practice
Regression analysis, machine learning classifiers, and time-series modeling represent common approaches when sifting through decades of outcomes. Time-series methods track how team performance evolves within a single season and across multiple campaigns, revealing cycles of improvement or decline that align with roster changes or coaching adjustments. Cluster analysis groups similar game situations together, allowing observers to compare current contests against historical analogs and calculate probability distributions for various results. Software platforms process millions of data points in hours, and outputs often highlight correlations between specific player combinations and elevated win rates that hold steady over ten or more seasons.
Observed Patterns Across Sports
In baseball, studies of pitch location and batted-ball outcomes have identified repeatable advantages for certain defensive alignments that appear in both regular season and postseason play. Soccer datasets reveal consistent regional differences in goal-scoring rates tied to league style and pitch dimensions, while basketball records show predictable shifts in three-point attempt volume following rule modifications. One documented case involved researchers who examined twenty years of National Basketball Association games and isolated a late-season performance dip among teams that had clinched playoff berths early; the pattern repeated across multiple conferences and persisted after adjustments for opponent strength.

Further examinations of endurance sports such as marathon running and cycling have uncovered pacing strategies that correlate with successful finishes when historical split times are compared against course profiles. These findings rely on synchronized GPS and timing data that have become standard since the early 2000s. Observers note that the same methodological framework applied to team sports can extend to individual events, provided sufficient longitudinal records exist.
Integration of Advanced Metrics
Modern analysis layers traditional box-score numbers with tracking data captured by optical and sensor systems. Expected goals models in soccer, for example, assign values to shot locations and types based on thousands of prior attempts, and these models update continuously as new matches occur. Similar expected-value calculations now exist for basketball shot selection and baseball defensive positioning. When analysts compare current season figures against historical baselines, deviations often signal either temporary anomalies or emerging structural changes in team composition. A September 2026 data summit hosted by several international federations is scheduled to release standardized tracking formats that will further align datasets across continents and facilitate cross-sport comparisons.
Limitations and Validation Steps
Even robust patterns require repeated testing against independent samples to confirm stability. Sample-size constraints affect rarer events such as perfect games or shutouts, and rule changes can render older data less relevant. Analysts therefore segment datasets by era and apply cross-validation techniques that withhold recent seasons for testing purposes. External shocks, including pandemics or major geopolitical events, occasionally disrupt established rhythms, and models must incorporate dummy variables to account for these interruptions. Research published through academic channels continues to stress the importance of transparent methodology so that subsequent teams can replicate findings under identical conditions.
Conclusion
Historical data analysis supplies a structured lens for interpreting athletic outcomes, and the volume of available records grows each season as sensor technology and league reporting requirements expand. Teams and academic groups that maintain rigorous validation protocols extract actionable sequences from these archives, while ongoing standardization efforts promise greater comparability across regions. The patterns identified today rest on evidence accumulated over generations of competition, and continued refinement of analytical tools ensures that future examinations build directly on established foundations rather than starting anew.